ORIGINAL RESEARCH |
https://doi.org/10.5005/jp-journals-10080-1534 |
Investigating the Growth of Pseudomonas aeruginosa and Its Influence on Osteolysis in Human Bone: An In Vitro Study
1,3Orthopaedic Surgery Division, College of Medicine, Sultan Qaboos University, Muscat, Oman
2Department of Microbiology, College of Medicine, Sultan Qaboos University, Muscat, Oman
Corresponding Author: Ahmed Al Ghaithi, Orthopaedic Surgery Division, College of Medicine, Sultan Qaboos University, Muscat, Oman, Phone: +96899166911, e-mail: a.alghaithi@squ.edu.om
How to cite this article: Al Ghaithi A, Al Bimani A, Al Maskari S. Investigating the Growth of Pseudomonas aeruginosa and Its Influence on Osteolysis in Human Bone: An In Vitro Study. Strategies Trauma Limb Reconstr 2021;16(3):127–131.
Source of support: This work was supported by Oman Research Council through the National Individual Innovation Competition 2016.
Conflict of interest: None
ABSTRACT
Background: Isolation of the causal microorganisms in osteomyelitis presents a major challenge for treating clinicians. Several methods have been proposed to rapidly and accurately identify microorganisms. There has been an increasing interest in using Raman spectroscopy in the field of microbial detection and characterisation. This paper explores the use of Raman spectroscopy identification as one of the most difficult-to-isolate microorganisms causing osteomyelitis.
Methods and results: Fresh healthy human bone samples were collected from patients undergoing a total knee replacement. These samples were then inoculated with fresh overnight Pseudomonas aeruginosa (PAO) cultures. Bacteria growth and bone ultrastructural changes were monitored over a period of 6 weeks. The experiment demonstrated ultrastructural bony destruction caused by osteolytic PAO secretions. Raman-specific spectral signatures related to the cellular membranes of PAO structures were spotted indicating survival of bacteria on the bone surface.
Conclusion: This study showed the promising ability of Raman spectroscopy to identify the presence of bacteria on the surface of inoculated bone samples over time. It was able to detect the osteolytic activity of the bacteria as well as ultrastructure specific to PAO virulence. This method may have a role as an aid to existing diagnostic methods for fast and accurate bacterial identification in bone infection.
Keywords: Biofilm, Infection, Osteomyelitis.
INTRODUCTION
Several diagnostic modalities are available for the evaluation of bone infection. The isolation of the causal microorganisms by direct bone or blood culture is currently used for decisions in definitive management. However, bacterial growth from obtained samples usually takes days and unfortunately, failure to isolate is common.1 Other diagnostic methods have been proposed for fast and accurate identification of microorganisms, e.g., fluorescence immunoassay, mass spectroscopy, polymerase chain reaction, flow cytometry, and vibrational spectroscopic methods viz., Raman.2 Raman spectroscopy is an evolving technology in the field of microbial detection and characterisation. It is based on a light-scattering technique where the light is generated by a high-intensity wavelength laser light source that focuses on the object of interest. The scattered light is then recorded as a wavelength change by sensors. Light scattering results from particle vibrations from the interaction of light with chemical bonds within the material examined. Recorded light scattering provides detailed information on the molecular structure, crystallinity, and polymorphism which, in turn, gives a unique fingerprint for each molecule. Researchers have been able to perform a non-destructive real-time single bacterium identification assay using Raman spectroscopy.3 Hamasha et al. were able to discriminate between pathogenic from nonpathogenic strains of Escherichia coli.4 Raman spectroscopy has the ability to evaluate the presence of different pigments produced by the organisms in culture. It can provide definite discrimination of various intracellular pigmentation without the need for complex processing.5 In vitro experimental work on Raman spectroscopy has shown its potential to pick up bacterial osteomyelitis. It has demonstrated bone destruction caused by Staphylococcus aureus with characteristic spectral shift of the S. aureus carotenoid pigment.6
Osteomyelitis caused by Pseudomonas aeruginosa (PAO) presents significant challenges to treating clinicians compared to other bacterial osteomyelitis.7 It is associated with greater risks of treatment failure and recurrence due to the high resistance to antibiotics.8 Under-reporting of PAO osteomyelitis can be attributed to culture failure or due to heavy growth of skin flora.7 The aim of this study is to explore fast identification of the PAO bacteria and examine osteolysis-related activity through the use of vibrational Raman spectroscopy.
MATERIALS AND METHODS
Bone Samples Preparation
The study was approved by the institutional ethical committee at College of Medicine, Sultan Qaboos University, Muscat, Oman (REF. NO. SQU-EC1039114). Following informed consent, sterile cancellous bone pieces measuring 1–2 cm2 were obtained from patients undergoing total knee replacements for primary osteoarthritis. An absence of a history of infection or surgery in the affected knee was an inclusion criterion. The specimens were stored under sterile conditions in normal saline (0.9% NaCl solution, pH 7.4) at –20°C until the day of bone samples preparation. Sterility was maintained and confirmed by culture swabs taken prior to sample inoculation. Further corroboration was obtained from a record of none of the patients developing an infection subsequently. Bone samples were added to a bacterial inoculum which was prepared from a fresh overnight PAO culture (bacterial concentrate range of 1 × 10⁶ to 1 × 10⁷ colony-forming units per millilitre was mixed with sterile normal saline). The control bone samples were soaked in sterile normal saline. Each mixture contained 12 bone pieces. Both groups were incubated for 6 weeks at 37°C to allow bacterial growth and multiplication. Culture swabs were taken every week to ensure the sterility of the control specimens and bacterial viability in the inoculated group.
Bacterial Growth and Bone Raman Examination
Raman Measurement and Spectroscope Setting
One of the major challenges in analysing Raman spectra of biological tissues is the low signal-to-noise ratio due to the spectra overlapping with the background fluorescence produced by the examined sample.9 Strong background fluorescence results in increasing errors in signal identification and intensity measurement. Several approaches have been developed to minimise the fluorescence background, such as laser excitation wavelength, acquisition time, and photobleaching.7,8 In this experiment 1064 nm excitation laser (I-Raman Ex spectrometer, BWTek, Newark, USA) was used as it offers significant advantages over other commercially available lasers (e.g., 532 or 785 nm) in dealing with background fluorescence9 and spectral measurement was taken in a spectral range of 200–2000 cm−1 using a –20o TE cooled CCD camera (BWTek, Newark, USA). Signal measurements were taken from five different spots for each examined sample. Acquisition time was also increased to 30 seconds. These measures have minimised the fluorescence in the acquired signal.
Data Analysis and Representation
BWSpec® software (BWTek, Newark, USA) was used for analysis of the obtained spectra. The software allowed automated signal baseline correction that minimises background signal for a low noise signal. Statistical analysis was carried out using the Statistical Package for Social Sciences 2020 (SPSS) (IBM Corporations, New York, USA). A significant difference was set at a p <0.05.
RESULTS
Bone Micro-architectural Changes
Figure 1 shows a comparison of the average readings between the two groups after 6 weeks of incubation while Figure 2 shows normal human bone spectra along with the band assignment.10 The spectral readings of the inoculated samples showed differences in mineral crystallinity, collagen cross-linking ratios, and depolarisation ratios of mineral and collagen fibril.
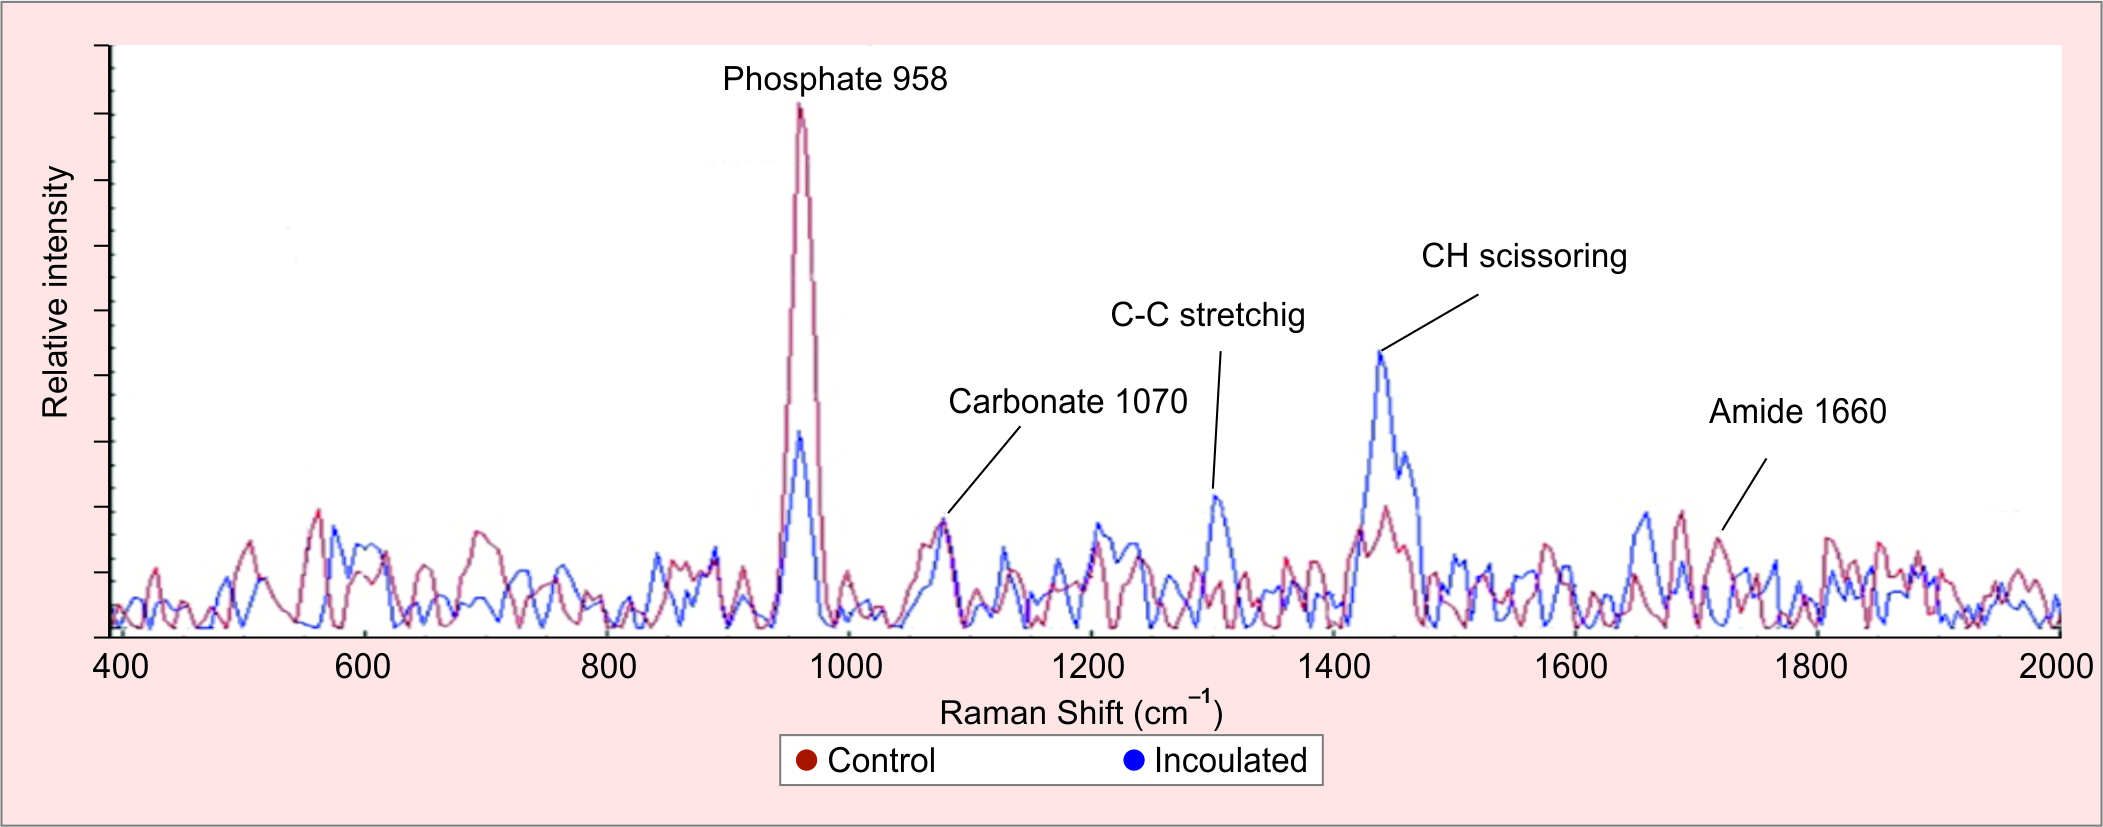
Fig. 1: A comparison of the average measured spectra after 6 weeks between the control bone samples and inoculated samples with PAO. The graph shows a drop of spectra intensity when comparing the control (red) to inoculated samples (blue). A close look at the phosphate signal at 958 cm–1 shows a significant drop can be noticed when comparing the groups indicating a loss of mineral content. The same applies to the matrix signal at 1660 cm–1. In addition, there is an evolving signal centered at 1302 and 1444 cm–1 related to C–C stretching and CH scissoring respectively. These signals are related to PAO structural content and secretions

Fig. 2: This shows normal healthy bone spectra. The X-axis represents acquired mineral-matrix signals from the bone surface where the normal phosphate peak is centred at 958 cm–1, carbonate at 1070 cm–1, amide I at 1660 cm–1, and amide II 1684 cm–1. The Y-axis represents the intensity of the signal. The higher the intensity, the higher the presentation of molecule on the bone surface
The mineral content of the bone has dropped over time as suggested by a decrease of the mineral to matrix ratios of phosphate 958 cm–1 to amide 1660 cm–1 (a ratio of 1.61 at week 1 and a ratio of 0.40 at week 6) and carbonate 1070 cm–1 to amide 1660 cm–1 (ratio of 5.28 at week 1 and ratio of 0.51 at week 6). This was as a result of an alteration of bone crystallinity (phosphate 958 cm–1 was substituted by carbonate 1070 cm–1) as represented by the increase in carbonate to phosphate ratio in the inoculated group compared to control over the 6 weeks (week 1: 0.30; week 6: 0.79) (Table 1).
| Average ratios | Weeks | |||
|---|---|---|---|---|
| 1 | 2 | 3 | 6 | |
| Carbonate 1070 cm–1/Phosphate 958 cm–1 | ||||
| Inoculated | 0.3 | 0.41 | 0.61 | 0.79 |
| Control | 0.23 | 0.14 | 0.13 | 0.16 |
| Carbonate 1070 cm–1/Amide 1660 cm–1 | ||||
| Inoculated | 1.61 | 1.08 | 0.90 | 0.40 |
| Control | 8.74 | 2.57 | 3.88 | 3.96 |
| Phosphate 958 cm–1/Amide 1660 cm–1 | ||||
| Inoculated | 5.28 | 2.62 | 1.46 | 0.51 |
| Control | 9.31 | 6.82 | 21.60 | 24.85 |
Bacterial Growth Detection
To investigate secondary spectral changes associated with PAO bacterial infection, signals related to bacterial pigmentations, metabolic products, and bone sample response were studied. The inoculated bone samples showed intense Raman bands around 1444 cm–1 (C–H stretching) which increased in signal intensity as the incubation period progressed (Fig. 3). The signal had almost tripled throughout the experiment. Another visible signal was detected at 1302.8 cm–1 linked to C–C scissoring which increased in intensity in the inoculated bone samples during the incubation. The signal intensity tripled during the 6 weeks period (Fig. 4).
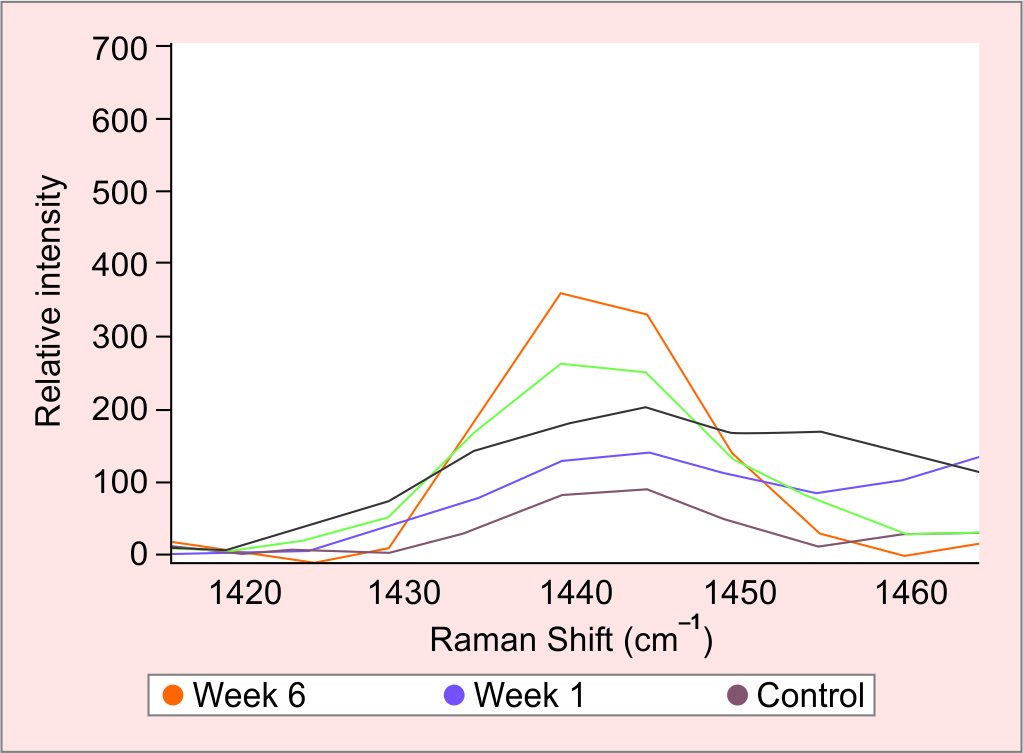
Fig. 3: The inoculated bone samples show intense Raman bands around 1444 cm–1 (C–H stretching), it shows a continuous increase in signal intensity as the incubation period increased between week 1 in purple and week 6 in orange. The signal was almost tripled throughout the experiment period which linked to the changes in the lipid content of PAO biofilm, characteristic of biofilm maturation
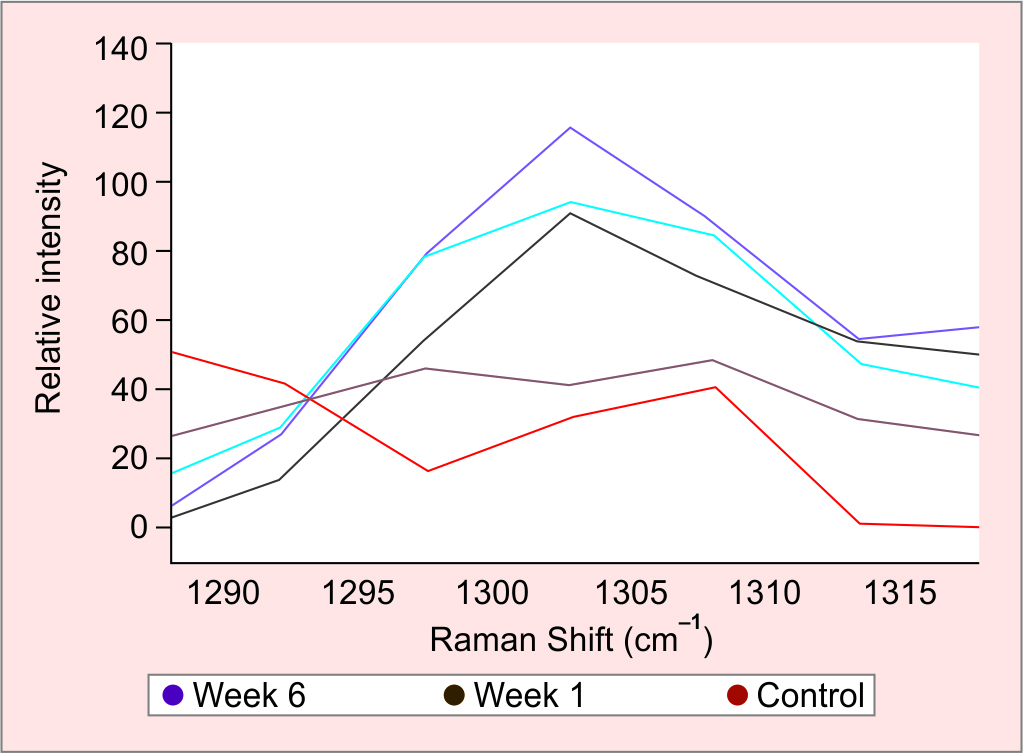
Fig. 4: The inoculated bone samples show intense Raman bands around 1302.8 cm–1 (C–C stretching), which are linked to branched-chain saturated fatty acid of 12-methyltetradecanoic acid expressed by PAO biofilm responsible for the virulent activity. The graph shows a continuous increase in signal intensity as the incubation period increased between week 1 in brown and week 6 in purple. The signal was almost tripled throughout the experiment period
DISCUSSION
This experiment has demonstrated a gradual drop of both mineral and organic content on the surfaces of PAO inoculated bone samples as compared to the controls.11 The observed damage can be attributed to the virulent osteolytic secretions produced by PAO on the bone surface (e.g., pyocyanin). This can be demonstrated in the inoculated samples by the amide I band shift from 1660 cm–1 (hydrogen-bonded structure) to 1684 cm–1 (nonhydrogen-bonded structure) (Table 1). The observed vibrational displacement is the result of the loss of the strong collagen fibril intramolecular hydrogen bonds (carboxyl group).12 The carboxyl group increases the mechanical stability of collagen triple-helix stability and contributes to the spacing of the structural network. Therefore, the inter-strand hydrogen bond loss causes network structure destabilisation by unfolding the helical collagen chains. This results in a loss of bone strength to withstand pressure and, subsequently, losing the compressibility of the bone matrix, and increasing the vulnerability to deformation.13
The results have shown a continuous increase in the peak around 1444 cm–1 as the incubation period progressed which matches the values previously stated from C–H scissoring.11,14 The observed spectral behaviour between 1440 and 1445 cm−1 can be linked to the changes in the lipid content of bacterial biofilm.15 High lipids expression is a characteristic of gram-negative bacterial biofilm maturation like PAO.16 Cellular membranes of bacteria primarily consist of phospholipids (PLs) which are formed by two hydrophobic hydrocarbon chains (tails) and a phosphate head group (Fig. 5).17 The observed signal peak at 1441 cm–1 is attributed to C–H scissoring in the hydrocarbon chain of PLs tails.11 PAO has the ability to produce various types of PLs which have different structural forms. PLs play a major role in cell communication, cell division, chromosomal replication, and contribute to the pathogenicity of PAO.16 PLs like rhamnolipids are more specific to PAO however, these are less predominant in mature biofilm. There are biosurfactant properties that display surface activity, such as drug resistance, biofilm formation, and extracellular matrix biofilm protection.14,18

Fig. 5: Shows the general structure of phospholipids which has one hydrophilic head plus two hydrophobic tails and 12-methyltetradecanoic acid which contains a branched chain of saturated fatty acid17
Another peak, centered at 1302 cm–1, was also observed with the progression of the incubation period (Fig. 5). This signal matches the values attributed to C–C scissoring which is linked to a branched-chain saturated fatty acid of 12-methyltetradecanoic acid (12-MTA);19 12-MTA is expressed by the host surface and exhibits antibacterial properties.20 It inhibits the production of extracellular surfactants and represses bacterial swarming, swimming, colony wetness, and biofilm formation in PAO infection.20,21 The 1302 cm–1 signal intensity of 12-MTA increased over time with the increase of PAO growth and colonisation. It was difficult to identify any signals pertaining to known virulent secretions of PAO. Conversely, all the signal values specified to PAO virulent osteolytic secretions were either very weak or superimposed by the fluorescence background (e.g., pyocyanin C–H in-plane bend at 1352 cm−1, CH3 wag, and C–H in-plane bend at 1511 cm−1).22
This study has shown the promising ability of Raman spectroscopy to identify the existence of PAO on the bone surface and demonstrated the resultant ultrastructural bony changes caused by osteolytic secretion. The occurrence of background fluorescence has caused significant variations in signals intensities, prohibiting potentially accurate identification of a given bacterial signal. However, with further experimental, animal, and clinical studies may have a role as an adjunct to existing diagnostic methods for fast and accurate bacterial identification.
LIMITATION
The in vitro nature of this study does not reflect a real-life clinical scenario. The role of host immune response and the possibility of multiple organism infections have not been studied. Further work should be done at the in vivo level to study the contribution of these and other factors.
CONTRIBUTION
Ahmed Al Ghaithi and Sultan Al Maskari conceived and designed this study; Ahmed Al Ghaithi and Atika Al Bimani performed the experiments; Ahmed Al Ghaithi and Sultan Al Maskari analysed and discussed the data; and Ahmed Al Ghaithi, Sultan Al Maskari, and Atika Al Bimani wrote the manuscript revised the manuscript; all authors read and approved the manuscript.
REFERENCES
1. Lew DP, Waldvogel FA. Osteomyelitis. Lancet Lond Engl 2004;364(9431):369–379. DOI: 10.1016/S0140-6736(04)16727-5.
2. Franco-Duarte R, Černáková L, Kadam S, et al. Advances in chemical and biological methods to identify microorganisms—from past to present. Microorganisms 2019;7(5):130. DOI: 10.3390/microorganisms7050130.
3. Strola SA, Baritaux J-C, Schultz E, et al. Single bacteria identification by Raman spectroscopy. J Biomed Opt 2014;19(11):111610. DOI: 10.1117/1.JBO.19.11.111610.
4. Hamasha K, Mohaidat QI, Putnam RA, et al. Sensitive and specific discrimination of pathogenic and nonpathogenic Escherichia coli using Raman spectroscopy–a comparison of two multivariate analysis techniques. Biomed Opt Express 2013;4(4):481–489. DOI: 10.1364/BOE.4.000481.
5. Sandt C, Smith-Palmer T, Pink J, et al. Confocal Raman microspectroscopy as a tool for studying the chemical heterogeneities of biofilms in situ. J Appl Microbiol 2007;103(5):1808–1820. DOI: 10.1111/j.1365-2672.2007.03413.x.
6. Khalid M, Bora T, Ghaithi AA, et al. Raman Spectroscopy detects changes in bone mineral quality and collagen cross-linkage in Staphylococcus infected human bone. Sci Rep 2018;8(1):9417. DOI: 10.1038/s41598-018-27752-z.
7. Calhoun JH, Manring MM, Shirtliff M. Osteomyelitis of the long bones. Semin Plast Surg 2009;23(2):59–72. DOI: 10.1055/s-0029-1214158.
8. Laghmouche N, Compain F, Jannot A-S, et al. Successful treatment of Pseudomonas aeruginosa osteomyelitis with antibiotic monotherapy of limited duration. J Infect 2017;75(3):198–206. DOI: 10.1016/j.jinf.2017.06.006.
9. Pence I, Mahadevan-Jansen A. Clinical instrumentation and applications of Raman spectroscopy. Chem Soc Rev 2016;45(7):1958–1979. DOI: 10.1039/c5cs00581g.
10. Morris MD, Mandair GS. Raman assessment of bone quality. Clin Orthop 2011;469(8):2160–2169. DOI: 10.1007/s11999-010-1692-y.
11. Zięba-Palus J, Michalska A. Photobleaching as a useful technique in reducing of fluorescence in Raman spectra of blue automobile paint samples. Vib Spectrosc 2014;74:6–12. DOI: 10.1016/j.vibspec.2014.06.007.
12. Movasaghi Z, Rehman S, Rehman DIU. Raman spectroscopy of biological tissues. Appl Spectrosc Rev 2007;42(5):493–541. DOI: 10.1080/05704920701551530.
13. Shoulders MD, Raines RT. Collagen structure and stability. Annu Rev Biochem 2009;78:929–958. DOI: 10.1146/annurev.biochem.77.032207.120833.
14. Magalhães FL, Machado AMC, Paulino E, et al. Raman spectroscopy with a 1064-nm wavelength laser as a potential molecular tool for prostate cancer diagnosis: a pilot study. J Biomed Opt 2018;23(12):1–6. DOI: 10.1117/1.JBO.23.12.121613.
15. Keleştemur S, Avci E Çulha M. Raman and surface-enhanced Raman scattering for biofilm characterization. Chemosensors 2018;6(1):5. DOI: 10.3390/chemosensors6010005.
16. Pseudomonas aeruginosa responds to exogenous polyunsaturated fatty acids (PUFAs) by modifying phospholipid composition, membrane permeability, and phenotypes associated with virulence. BMC Microbiol 2018;18:117. DOI: 10.1186/s12866-018-1259-8.
17. Barák I, Muchová K. The role of lipid domains in bacterial cell processes. Int J Mol Sci 2013;14(2):4050–4065. DOI: 10.3390/ijms14024050.
18. Abdel-Mawgoud AM, Lépine F, Déziel E. Rhamnolipids: diversity of structures, microbial origins and roles. Appl Microbiol Biotechnol 2010;86(5):1323–1336. DOI: 10.1007/s00253-010-2498-2.
19. Gelder JD, Gussem KD, Vandenabeele P, et al. Reference database of Raman spectra of biological molecules. J Raman Spectrosc 2007;38(9):1133–1147. DOI: 10.1002/jrs.1734.
20. Inoue T, Shingaki R, Fukui K. Inhibition of swarming motility of Pseudomonas aeruginosa by branched-chain fatty acids. FEMS Microbiol Lett 2008;281(1):81–86. DOI: 10.1111/j.1574-6968.2008.01089.x.
21. Inoue T, Kuroda T, Ohara N. 12-Methyltetradecanoic acid, a branched-chain fatty acid, represses the extracellular production of surfactants required for swarming motility in Pseudomonas aeruginosa PAO1. Jpn J Infect Dis 2012;65(2):126–131. PMID: 22446119.
22. Polisetti S, Baig NF, Morales-Soto N, et al. Spatial mapping of pyocyanin in Pseudomonas aeruginosa bacterial communities using surface enhanced Raman scattering. Appl Spectrosc 2017;71(2):215–223. DOI: 10.1177/0003702816654167.
________________________
© Jaypee Brothers Medical Publishers. 2021 Open Access This article is distributed under the terms of the Creative Commons Attribution-Non Commercial-share alike license (https://creativecommons.org/licenses/by-nc-sa/4.0/) which permits unrestricted distribution, and non-commercial reproduction in any medium, provided you give appropriate credit to the original author(s) and the source, provide a link to the Creative Commons license, and indicate if changes were made. If you remix, transform, or build upon the material, you must distribute your contributions under the same license as original. The Creative Commons Public Domain Dedication waiver (http://creativecommons.org/publicdomain/zero/1.0/) applies to the data made available in this article, unless otherwise stated.